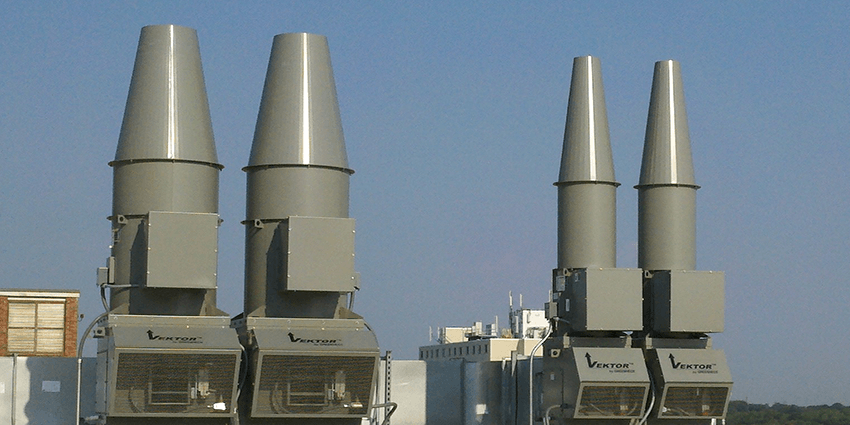
One of the critical features of a properly designed laboratory or industrial exhaust system is the exhaust stack. The exhaust stack helps ensure polluted exhaust is dispersed into the atmosphere before it can be re-entrained into building air intakes or settle on occupied areas such as building entrances or sidewalks.
This post examines key design features of an exhaust stack, the history of plume rise estimates and how they’ve changed over the years, and some of the important inputs in those estimates. We also look at dispersion estimates which provide even more detail to the exhaust plume movement once it is exhausted from the building.
The primary task of an exhaust stack is to keep building occupants and the surrounding area safe from hazardous concentrations of exhaust contaminants.
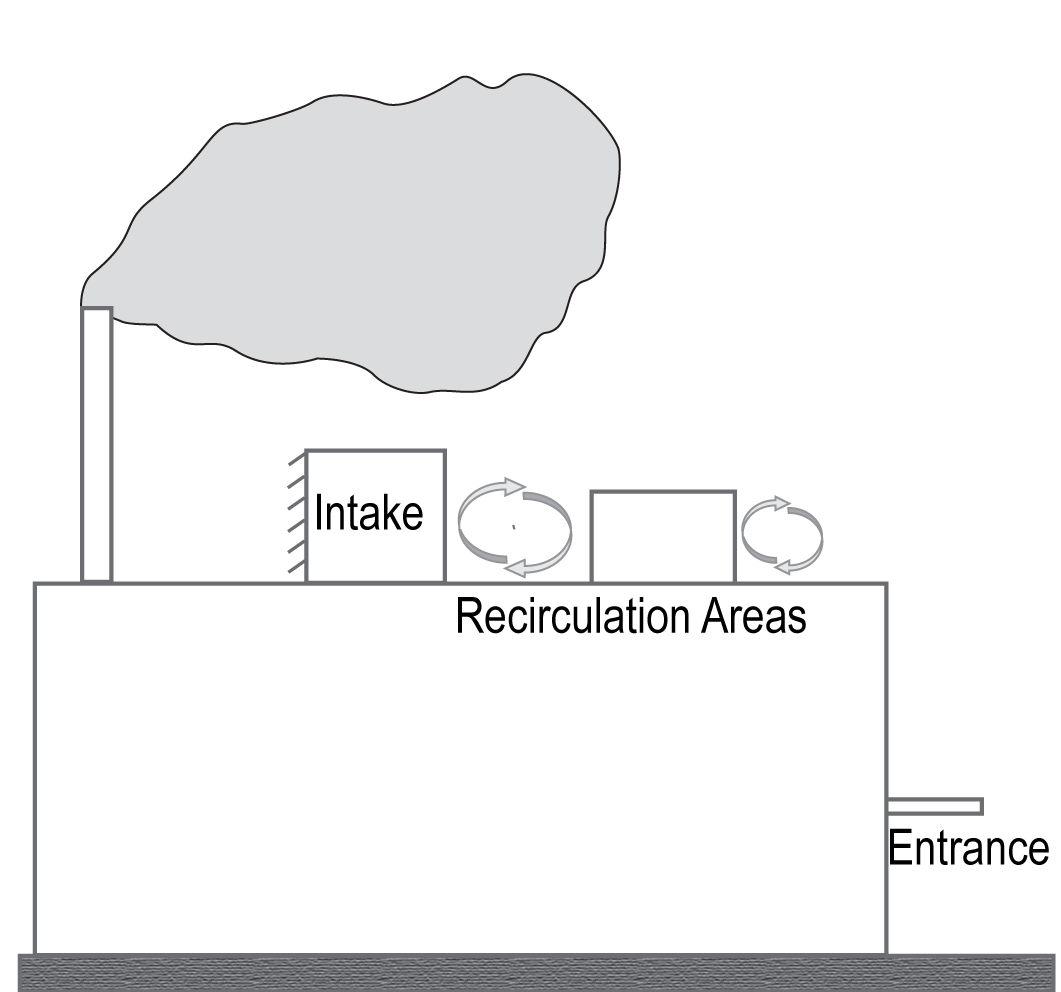 |
| Figure 1 -- Building example with an exhaust stack, air intakes, and entrance. |
Some key design parameters affecting proper exhaust stack designs include the physical stack height, exit diameter, exhaust air exit velocity, surrounding building structures, wind conditions, and contaminant concentration levels in the exhaust stream (Figure 1).
Many of these key design parameters use what many refer to as plume rise equations to determine the effective height of the exhaust plume. In 1969, G. A. Briggs published the paper, “Plume Rise,” for the U.S. Atomic Energy Commission. This paper contained equations for predicting exhaust plume heights. ASHRAE used a subset of this work, called the simplified Brigg’s equation (Figure 2) until 2011. The simplified equation predicted final plume rise for rooftop exhaust applications where momentum is dominant while neglecting buoyancy.
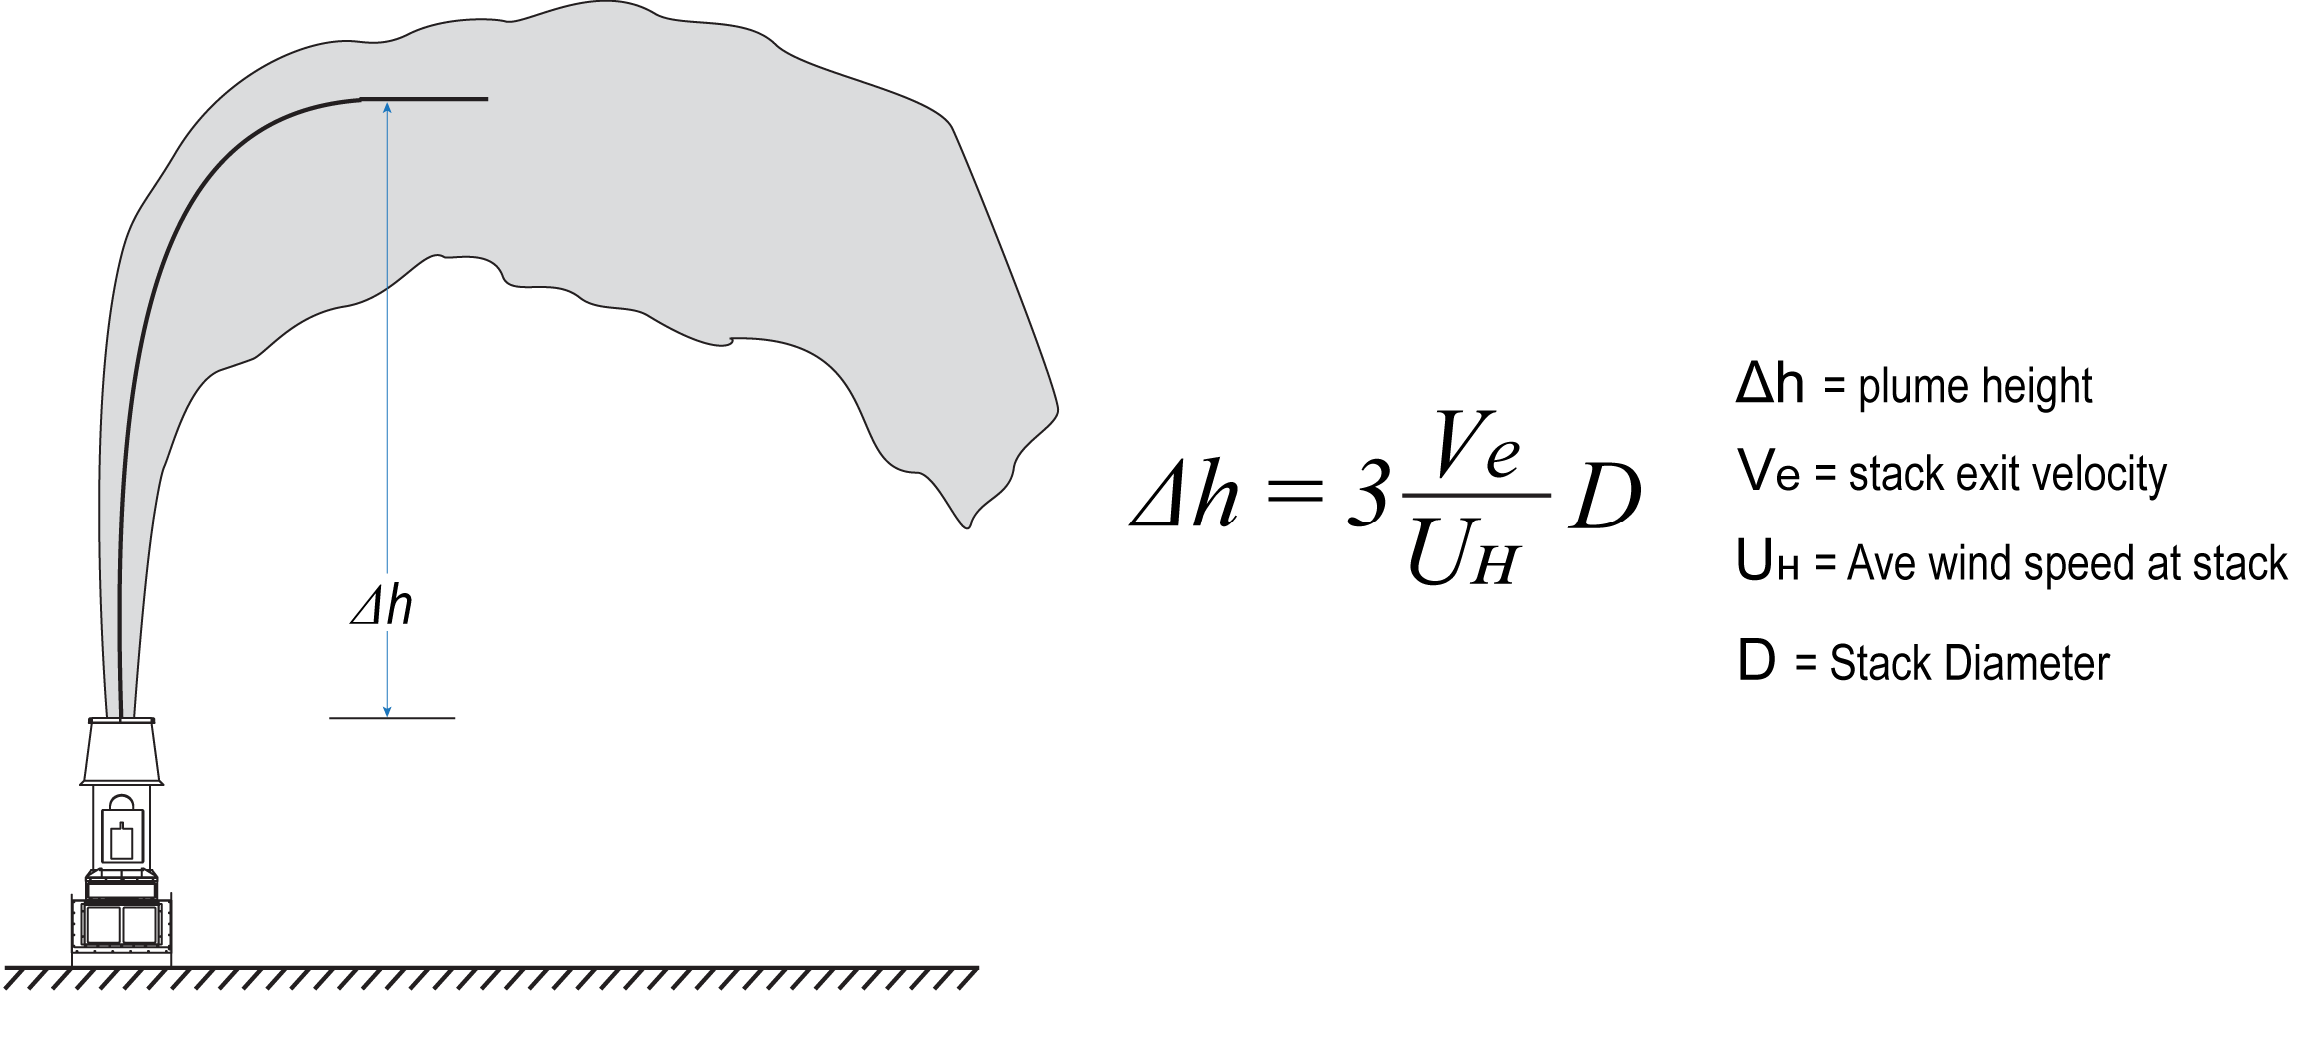 |
| Figure 2 -- Simplified Brigg’s equation |
The simplified Brigg’s equation served the industry well; however, it inflated calculated values under some conditions. ASHRAE introduced new equations for predicting plume rise in 2011. These are the “Momentum Flux” equations (Figure 3). They are far more complicated than the simplified Brigg’s equations and introduce new parameters such as land surface roughness and a logarithmic wind profile to provide more accurate results. These equations predict the plume rise along downwind distance rather than the single value calculated with the simplified Brigg’s equation. Momentum Flux equations also provide a maximum “final” plume rise value. This final plume rise cannot exceed the maximum value regardless of the downwind distance.
 |
| Figure 3 -- ASHRAE 2011 Momentum Flux equations. |
A simple example compares results (Figure 4) to help understand the difference in plume rise values between the simplified Brigg’s equations and the momentum flux equations.
Example:
Wind Speed 10mph
Exhaust Velocity 3000fpm
Building Height 30ft
Suburban Setting
Stack Diameter 2ft, Uncapped
(9424 cfm)
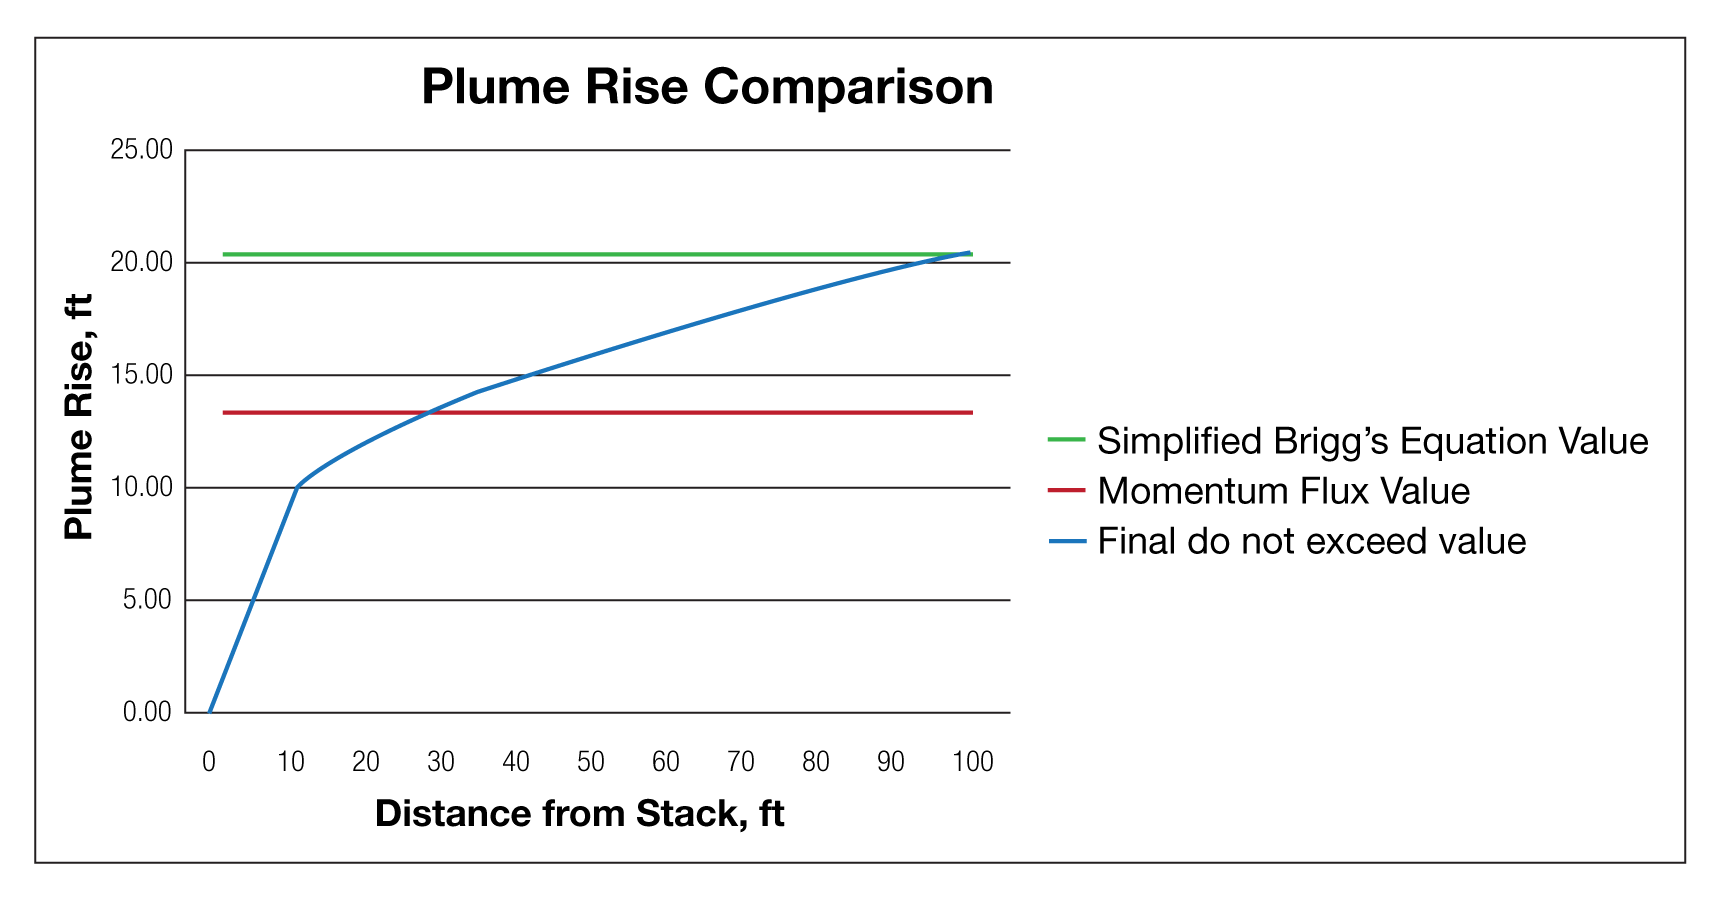 |
| Figure 4 -- Plume rise comparisons. |
One can quickly see the impact on plume rise values depending on which equation you are using and the downwind distance. There is roughly a 38% decrease in predicted plume rise from the simplified Brigg’s equation to the Momentum Flux final plume rise value. In this example, the final plume rise is 12.5 feet once you are 20 feet or more downwind.
A major factor that impacts the calculated plume rise using the Momentum Flux equation is surface roughness zo. This factor has also been called the terrain factor or atmospheric boundary layer parameter, depending on which reference you use. This factor indicates how “rough” the surface is that the wind and exhaust plume is traveling over. A higher value indicates a rougher surface like an urban area and thus lowers the calculated plume rise as surface friction tends to keep the exhaust from rising. A low value for zo indicates a smoother surface such as grasslands and allows the plume to rise faster. Fig. 3 includes the terrain category factors, which can result in significant changes in plume rise depending on the factor used.
A recent evaluation by ASHRAE members indicates the values shown for Urban 6.0 are extremely conservative and do not occur in practicality. Urban areas are much closer to the Suburban 2.1 values. The user is encouraged to seek site-specific zo values from reputable engineering firms specializing in wind studies if uncertain of the actual value or use AERSURFACE (EPA 2013), which you can download at www.epa.gov/scram.
A counteractive force to plume rise is stack tip downwash. Downwash occurs when the exit velocity of the exhaust plume is less than three times the windspeed at the stack and causes a wake on the leeward side of the stack where the exhaust plume recirculates.
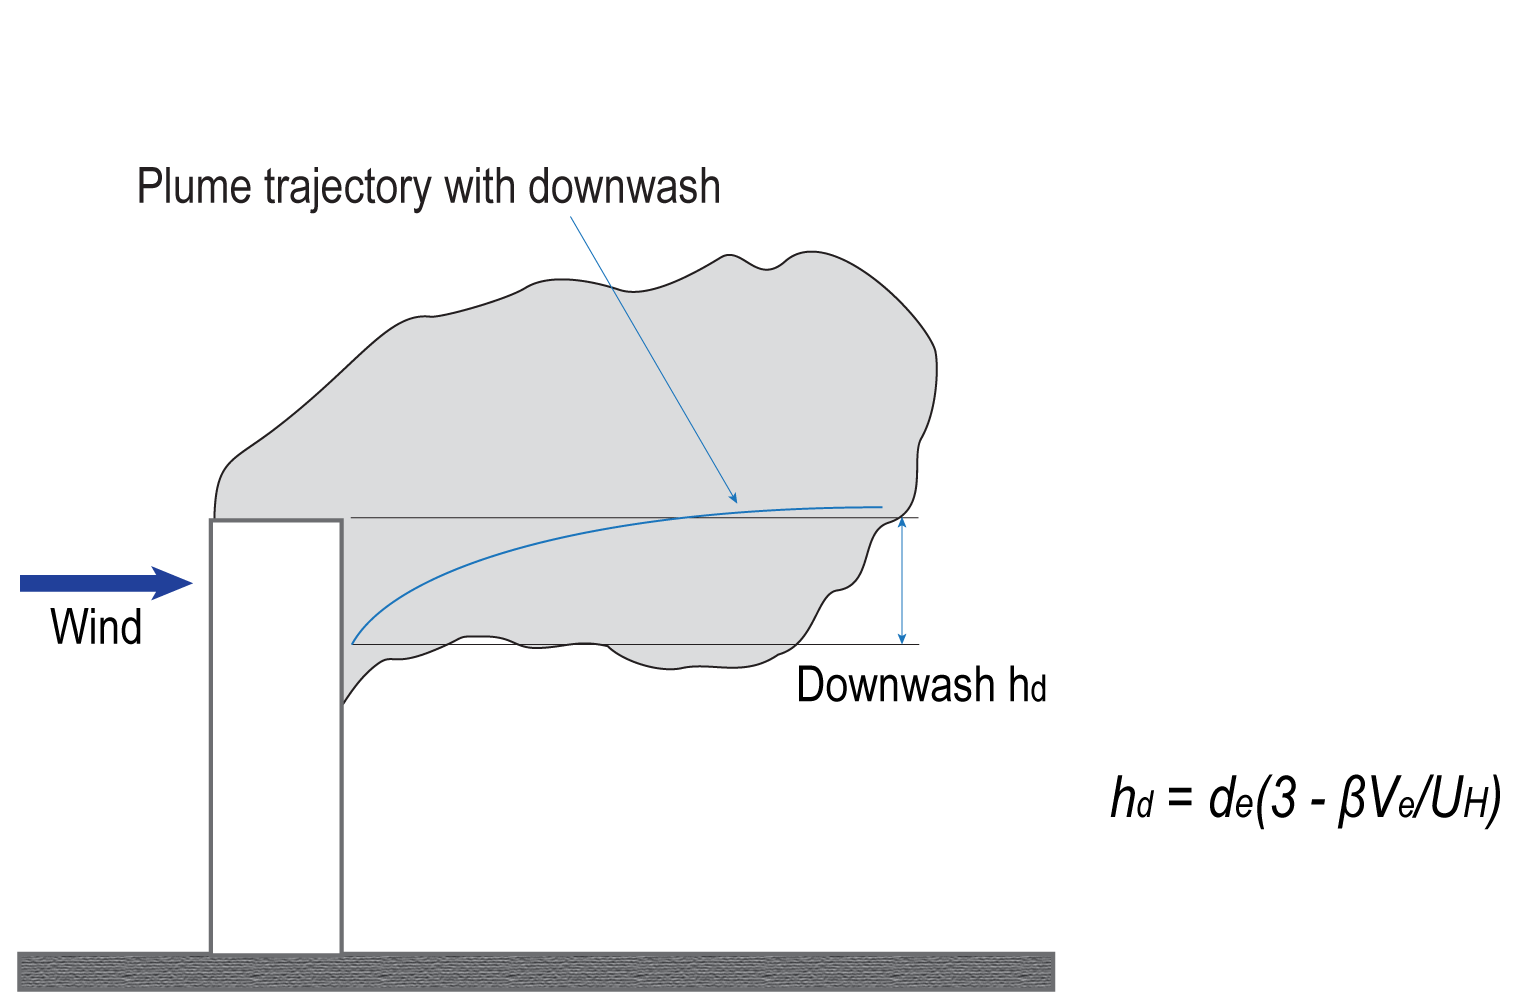 |
| Figure 5 -- Stack tip downwash. |
If downwash does occur, then the downwash value is subtracted from the plume rise value to obtain the true plume trajectory or final plume rise value.
Equivalent stack height (Figure 6) is the predicted maximum centerline height of the exhaust plume as it travels downwind. The equivalent stack height accounts for the physical stack height plus calculated plume rise and subtracts any downwash value. Despite the name, equivalent stack height should never be confused with the actual physical height of the stack.
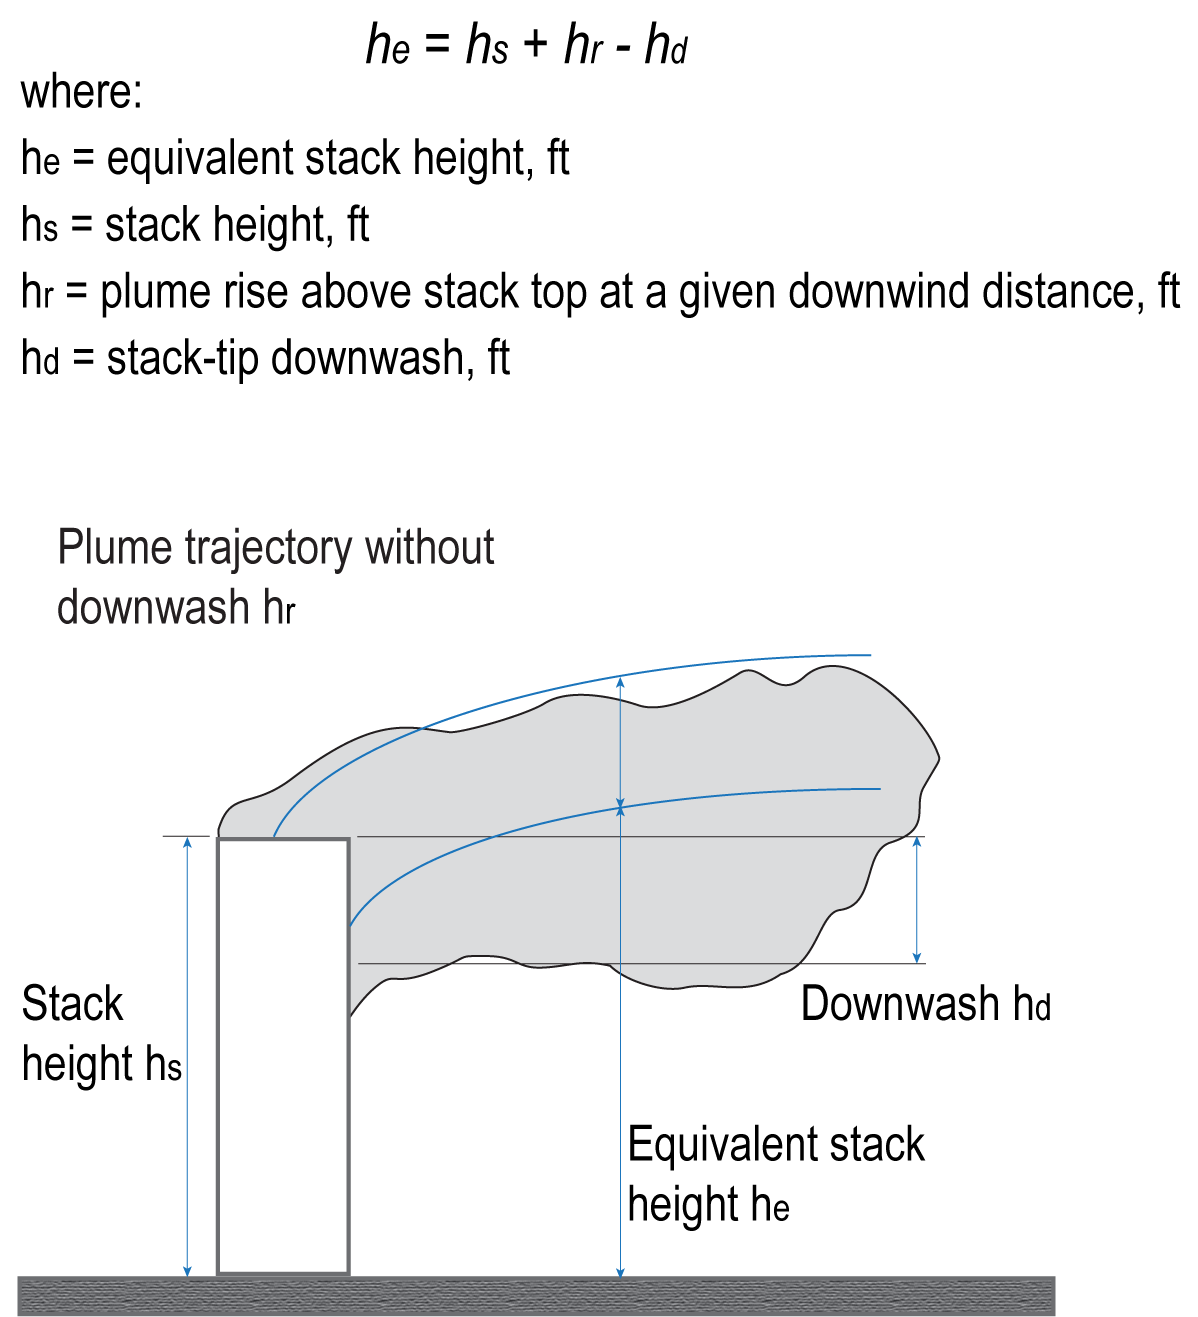 |
| Figure 6 -- Equivalent stack height. |
Equivalent stack height is the value engineers need to determine if the design has adequate exhaust stack height to avoid re-entrainment of exhaust air into air intakes or occupied spaces. Most manufacturers, such as Greenheck, provide plume rise values or equivalent stack height values. Make sure you understand which value you have and if it includes downwash if it applies. If you determine that the resulting value is insufficient for the site needs, several items can improve the stack design.
-Verify the design wind speed to ensure it has an appropriate value for the site location and follows ASHRAE calculations when converting from a meteorological station to the actual site location. The proper one percent design speeds for various locations are listed in the ASHRAE Fundamentals handbook if that is the design criteria.
-Validate the surface roughness zo value to verify it is adequate for the site location, i.e., using the Urban = 6.0 value is likely incorrect.
-Increasing exhaust velocity will increase plume rise and reduce downwash if it’s occurring
-Increase physical stack height by adding curb height, inline silencers, or add height to the stack itself
Plume rise evaluation is important in determining the safe operation of a laboratory or industrial exhaust, but it cannot account for every situation. Engineers need to be aware of prevailing wind directions and avoid air intakes at common downwind locations. Adjacent buildings, windscreens, and other obstructions can also impact the actual plume rise. Read the ASHRAE Applications handbook chapter 46, “Building Air Intake and Exhaust Design,” for more details.
ASHRAE introduced dilution or concentration calculations in 2015. These calculations are an extension of the plume rise equations already presented here. The basic theory is that exhaust plumes are not a singular centerline value but a three-dimensional body that expands horizontally and vertically as it travels downwind with diminishing concentrations away from the centerline. Engineers must know the extent the exhaust plume expands and the concentration levels in the plume to avoid entrainment or hazardous situations. These calculations are complex, and it is best to refer to a computerized program. For example, the concentration calculations for Greenheck’s Vektor and Fumejet products can be determined using our computer aided product selection software (CAPS). The CAPS output is a graphical representation to evaluate and modify inputs to obtain desired results and make appropriate fan selections.
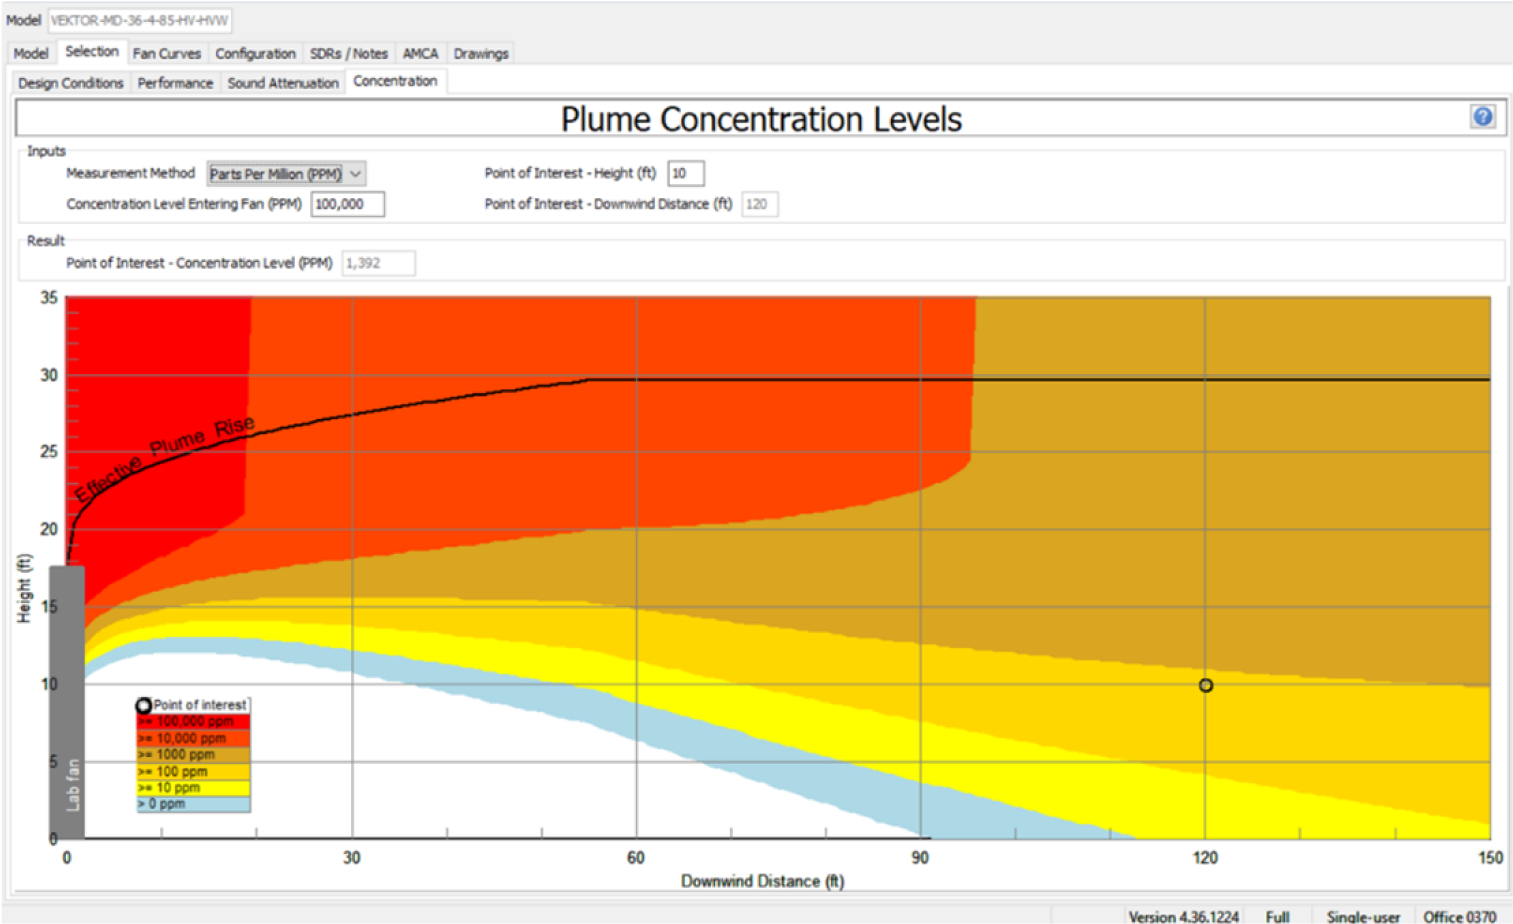 |
| Figure 7 -- Greenheck CAPS graphical dilution calculator example. |
The CAPS-generated graph (Figure 7) provides colored bands of concentration levels and shows downwash impact when it occurs. One can quickly view the graph to determine if the point of interest is at a low enough concentration level for the exhaust substance in question. For the tool to be used effectively, the user must know what is being exhausted and the concentration level. The user can then refer to the OSHA acceptable exposure limits for that substance and compare the values to determine if the stack design needs modification.
Good exhaust stack design can be complex, depending on the situation. Job sites with a relatively flat roof with minimal obstructions and low exhaust concentrations can use the plume rise equations and equivalent stack height provided in the Greenheck CAPS software. The result should be adequate when used with good engineering practices for placing exhaust stacks and air intakes. A more accurate analysis should look at the concentration graphs provided and evaluate those levels for safety. We recommend using a consulting engineer with expertise in exhaust stack design when dealing with hazardous exhaust levels such as BSL 3 and greater, labs, and complex building structures or campuses.
Learn more about fume exhaust and laboratory exhaust products.


from